Cyclistic Case Study
About the Company
In 2016, Cyclistic launched a successful bike-share offering. Since then, the program has grown to a fleet of 5,824 bicycles that are geotracked and locked into a network of 692 stations across Chicago. The bikes can be unlocked from one station and returned to any other station in the system anytime.
Until now, Cyclistic’s marketing strategy relied on building general awareness and appealing to broad consumer segments. One approach that helped make these things possible was the flexibility of its pricing plans: single-ride passes, full-day passes, and annual memberships. Customers who purchase single-ride or full-day passes are referred to as casual riders. Customers who purchase annual memberships are Cyclistic members.
Cyclistic’s finance analysts have concluded that annual members are much more profitable than casual riders. Although the pricing flexibility helps Cyclistic attract more customers, Moreno believes that maximizing the number of annual members will be key to future growth. Rather than creating a marketing campaign that targets all-new customers, Moreno believes there is a very good chance to convert casual riders into members. She notes that casual riders are already aware of the Cyclistic program and have chosen Cyclistic for their mobility needs.
Moreno has set a clear goal: Design marketing strategies aimed at converting casual riders into annual members. In order to do that, however, the marketing analyst team needs to better understand how annual members and casual riders differ, why casual riders would buy a membership, and how digital media could affect their marketing tactics. Moreno and her team are interested in analyzing the Cyclistic historical bike trip data to identify trends.
Scenario
You are a junior data analyst working in the marketing analyst team at Cyclistic, a bike-share company in Chicago. The director of marketing believes the company’s future success depends on maximizing the number of annual memberships. Therefore, your team wants to understand how casual riders and annual members use Cyclistic bikes differently. From these insights, your team will design a new marketing strategy to convert casual riders into annual members. But first, Cyclistic executives must approve your recommendations, so they must be backed up with compelling data insights and professional data visualizations.
Moreno has assigned you the first question to answer: How do annual members and casual riders use Cyclistic bikes differently?
Tools & Dataset
Tools: Microsoft Sql Server for data cleaning and analyzing, Tableau for data visualization.
Dataset: This dataset consists of 12 separate zip files. Datasets from 202101 to 202112 were used.
Since the data is in individual csv files, I first needed to aggregate the data in a single table. For this, I combined all the csv files in a new table using the UNION ALL command.

Pre-cleaning
In order to do this analysis, I needed verified and reliable data. Our administrator has turned off this data requirement. She shared with me the total 12-month data of the Cyclistic company for 2021. These data did not fully comply with ROCCC principles. There were irregularities, outliers, and noise in the data. It was my duty to ensure that this data is reliable and verified. I immediately started pre-cleaning the data. You can access pre-cleaning phase.
Data that needs to be cleaned:
-
Since we use Union all, all the rows in the tables we included are combined.
-
The ride_id column must be 16 characters. 457 rows were detected that did not comply with this rule.
-
The docked_bike data in the rideable_type column should be converted to classic_bike.
-
Outliers in the started_at and ended_at columns should be fixed.
-
The nulls and outliers in the station_name and station_id columns should be fixed.
-
Null values in lat and lng columns should be removed.


Clean & Analysis
After pre-cleaning the data, I moved on to the actual cleaning. Too much noise and null values were present in the data. These values could undermine the accuracy of the data. After doing this cleanup I got to work on the question given to me. I had to find the difference between casual riders and annual members and should make casual riders to annual members. I immediately started to work and started to get one step closer to the answer of the question by going to the analysis stage. You can access clean & analysis phase.
Cleaned Data:
-
457 rows cleaned that are not 16 characters.
-
312316 docked_bike rows converted to classic_bike.
-
84577 rows deleted for driving times less than 1 minute and 4012 rows deleted for driving times more than 1 day.
-
At least 1 null value in these columns has been deleted. and 47307 'Temp' rows deleted from start and end station names.
-
Null latitude and longitude values deleted.


More meaningful with visualization
I have completed the cleaning and analysis phase. In the process, I had already formed an insight. In order for these insights to be more descriptive and understandable, the data needed to be visualized. I also used Tableau Desktop for this visualization process. I visualized the data in a clear and understandable way as I went. I also made what I wanted to tell more understandable by creating a storytelling in this application. You can access the dashboards and storytelling.
Based on my analysis and insights, I have reached the following information:
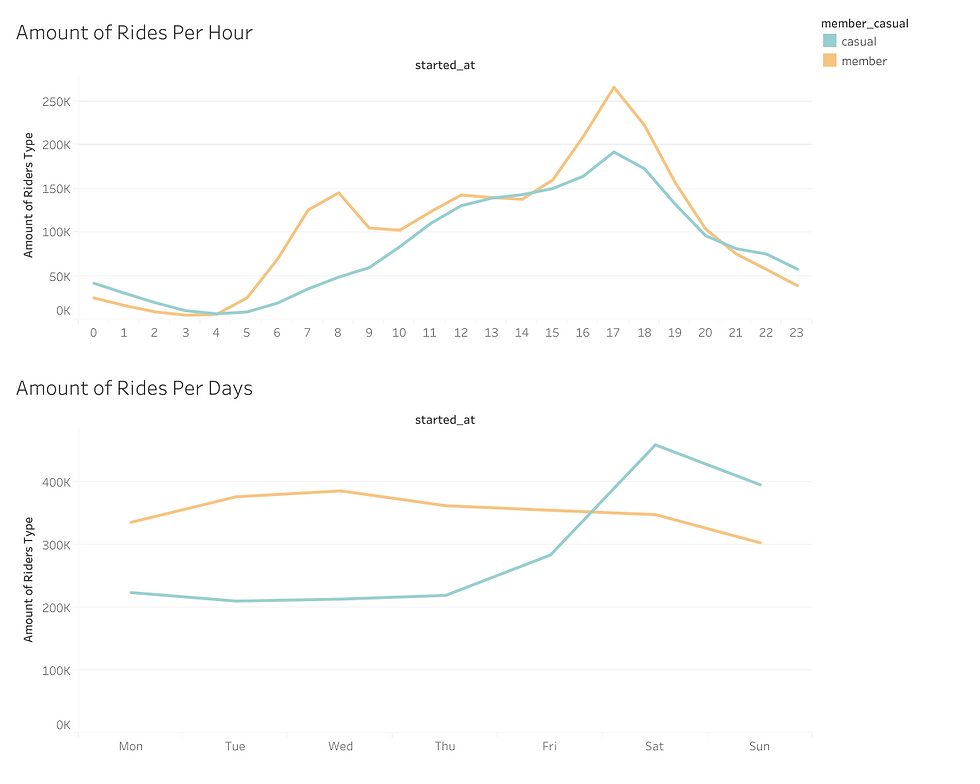
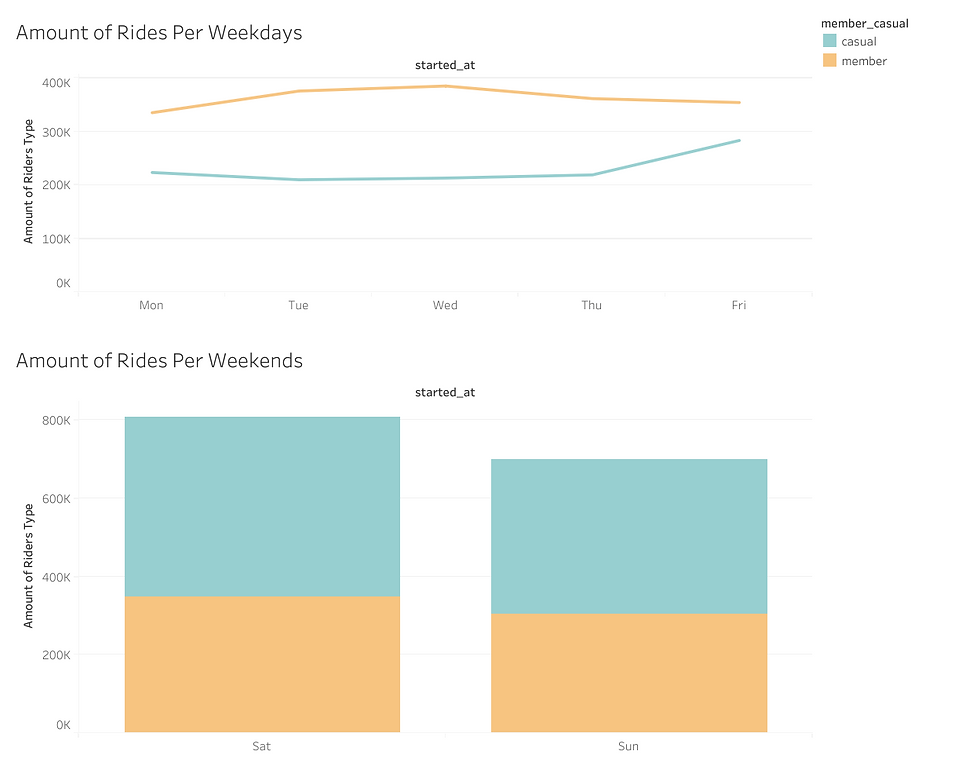
Both types mostly preferred classic bikes. I thought these bikes would be used mostly for hobby purposes. In addition, when we look at the hourly and daily visualizations in the later stages of the analysis, the annual members mostly used the bikes during commute and exit hours. On annual drives, we encountered data that was general and almost non-movement all week long. This situation was different for casual drivers. We have seen casual drivers actively using their bikes throughout the weekend, starting from the rush hour on Fridays.

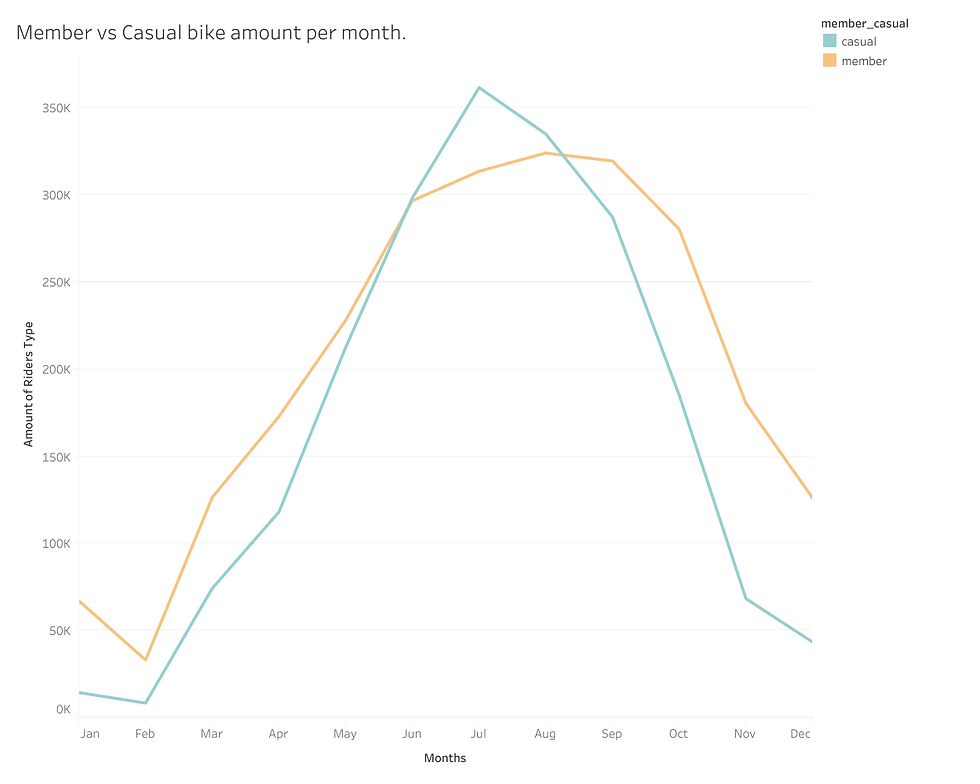
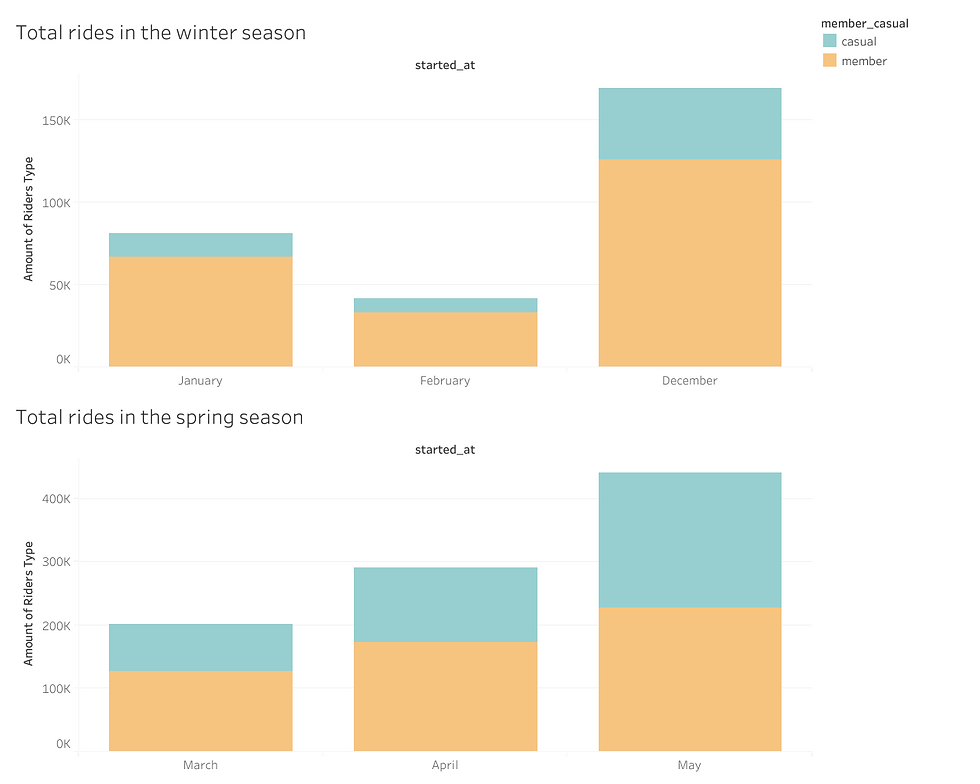
In the later parts of the analysis, the seasons greeted us. Casual drivers hardly used them, especially in the winter and spring seasons compared to other seasons of the year. When the summer and autumn seasons came, casual riders were using bicycles more actively than annual riders. This confirmed our insight. Casual drivers used their bikes mostly for hobby and sports purposes.

Summary & Insights
Our analysis and insights were complete. The final question we had to answer was how to convert casual drivers into annual drivers. Based on my analysis, I started to think about this issue. As can be clearly seen, casual drivers used bicycles mostly for hobby and sports purposes. We knew that casual riders use bikes especially on weekends. When the summer and autumn seasons came, there was a significant increase in the number of uses. Based on this insight, I asked my manager, Moreno, to offer discounts to ordinary drivers, especially on weekends. The main purpose here was not to convert casual drivers to annual members with the weekend discount. This discount was just a nice preparation for the summer and autumn seasons. I showed my manager Moreno two roadmaps. The first was the introduction of a membership system only for the summer and autumn seasons. The second was the introduction of discounts to annual memberships towards the end of the spring season. My manager Moreno talked about this situation with her managers, showing my analysis, insights and visualizations. They accepted the first option I suggested. Only for the summer and autumn seasons, casual riders were given a 50% discount. Thus, I completed this task given to me by cleaning, analyzing, visualizing and generating insights from data.